


Surface Pressure & Fronts
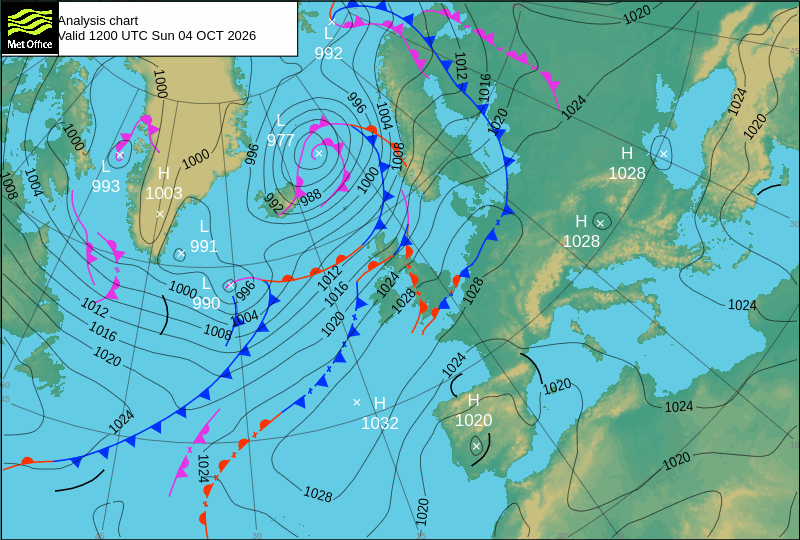
Met Office analysis and forecast charts for Europe and the North Atlantic.
Analysis - Sun 4 Oct 2026, 12:00 UTC
The chart image could not load. Please use the Met Office source link below.
━● Warm front
━▲ Cold front
●▲ Occluded front
H High pressureL Low pressure
Black pressure lines are isobars, labelled in hPa. Closer spacing generally indicates stronger winds. Click the chart to open it at full size.
Source: Met Office surface pressure charts · © Crown copyright
Normally updated around 07:30 and 19:30 UTC. Day 4 and 5 forecasts update once daily. This page checks again every 15 minutes while open.